
PRESENTING YOUR ACHIEVEMENT
data…
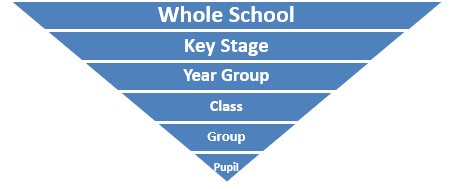
1. Have a clear sense of structure to your data so that you know you can access any information that you may need:
% below expected standard... % making below expected progress
% at expected standard... % making expected progress
% above expected standard... % making accelerated progress
…and, be able to break this down in to groups (eg boys, girls, more able, SEND,disadvantaged, etc).

3. Colours can help to show ‘significance’ etc – but don’t over-do it and be certain that you choose viable and generally accepted ‘thresholds’ (eg for the point at which you are saying a pupil is making ‘accelerated progress’).
4. Include pupil numbers as well as percentages (percentages with small cohorts can be misleading, particularly when looking at the ‘groups’). Remember also that some pupils may be counted in the data more than once (eg I might be a disadvantaged boy with SEND who is a persistent absentee…). Therefore if I am not performing well I could be affecting your data multiple times! Also, 0% of EAL pupils in Year 3J at the Expected Standard may represent only one pupil who is new to English… Similarly 100% of disadvantaged pupils in 6T making more than expected progress may also represent just one pupil.
5. Think about different audiences: pupils, parents, teachers, senior leaders, governors, Ofsted, LA, etc. The same data set is unlikely to serve all audiences. Plus, everybody likes a summative overview of distilled ‘big message’ data over a page or two! The detail (groups etc) can sit beneath this.
6. Take the time to analyse the data and extract key messages.There’s no point in just presenting a load of numbers! Formulate a narrative.

7. What patterns or performances are worthy of further action or a strategy, and which are just things to monitor and keep an eye on?
8. Make sure that your teacher assessments are accurate – otherwise it’s ‘rubbish in and rubbish out’ and you could be setting false hares running! Get involved in in-school and school-to-school moderation – and go to Local Authority training – in order to ensure accuracy in your teacher assessments.
9. Data is a useful way of quantifying performance – but it does not tell us everything about the human beings that live behind the numbers. There could well be a ‘back story’. If you do choose to highlight ‘outliers’ (ie the odd pupil whose unusual performance skews the figures), make sure you have case studies of actions taken with each one.
10. Remember, the principles above are just as relevant to other data collections (eg attendance, persistent absence, exclusions, surveys, etc).